Page on the dashboard: dashboard.biolovers.site/dashboard/edit — the Overview tab is what loads first when you sign in.
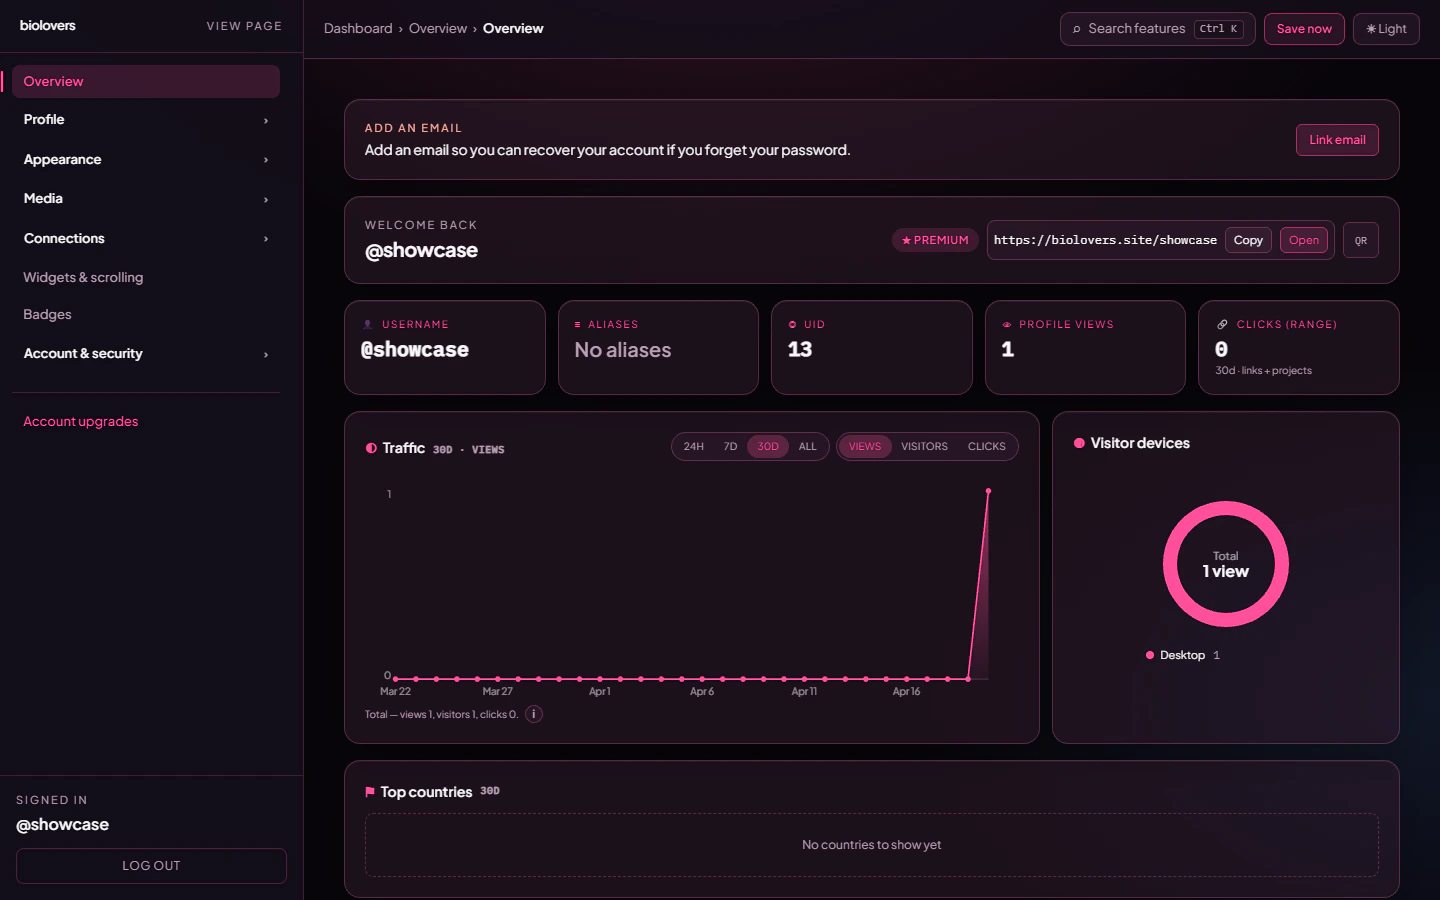
The Overview tab.
The header bar
The five small tiles
Range and metric switches
Two pill rows control what the charts show:- Range:
24h/7d/30d/All. The whole tab re-fetches when you change this. - Metric:
Views/Visitors/Clicks. Only the Traffic chart switches.
Traffic chart
Line + area chart of the metric you picked, broken into:- 24h range — one point per hour (UTC).
- Other ranges — one point per day (UTC).
Visitor devices donut
Pie ofDesktop / Mobile / Tablet / Unknown based on the user-agent. Filled in once you have at least one tracked view in the range.
Top countries
Bar chart of country codes (US, DE, BR, …) in the chosen range. Country comes from the visitor’s IP — VPN users may show as a different country.
Top clicked links
The top 10 social link chips visitors tapped, with the URL underneath each label.Top clicked projects
Same idea, but for project / portfolio cards inside your widgets.Top clicked integrations
Taps on the View Profile / Listen / Join buttons of your live tiles (GitHub card, Spotify card, Steam card, Discord card, server invite).How counting actually works
The exact rules, straight from the API:- Views are deduped once per IP per UTC month for the all-time
Profile viewstile, and once per IP per UTC day for the day-bucketed traffic chart. Reload your page from the same IP in the same window — only the first tap counts. - Owner visits do count. Browsing your own page from the dashboard tab still increments the view counter — there’s no owner filter on the view endpoint. If you want a clean number, use a private window with a different IP / VPN.
- Bots are filtered out. Requests that look like crawlers (Discord card preview, Twitter card, Google bot, etc.) are detected by user-agent and not counted.
- Clicks are not deduped. Every tap on a social link / project / integration tile is recorded, including repeated taps from the same visitor. Counting shows raw taps.
- Numbers refresh on the next view. They aren’t real-time to the second.
Common questions
Can I see who visited me by name?
Can I see who visited me by name?
No. We don’t log identities. Only aggregate numbers + country + device.
Why does the chart say 'No traffic in this range yet'?
Why does the chart say 'No traffic in this range yet'?
Either your link hasn’t been shared yet, or all the visits happened before the range you picked. Try All to see everything.
The clicks count says 0 but I tested it
The clicks count says 0 but I tested it
Click tracking does not dedupe — each tap records. If you genuinely see 0, the page may have been served as a bot (uncommon for a manual click) or the link is being opened with a middle-click that the page didn’t see.
What's a 'click' on an integration?
What's a 'click' on an integration?
Tapping the call-to-action on a live tile (View Profile, Listen on Spotify, Watch on YouTube, Join Server, etc.). Just looking at the card is not a click.
My own visits inflate my numbers
My own visits inflate my numbers
They do. Use a private window with a different IP / VPN to view your page without counting.
Related
Make people share your link
Pick a memorable URL and an alias.
Add live tiles
Spotify, YouTube, Twitch, Steam, GitHub.